
You may encounter pension data delivered in JSON files as a financial services professional (such as an asset manager, fiduciary manager, LDI manager, pension administrator, pension scheme analyst, etc). These JSON files contain a range of detailed information, including, but not limited to, pension scheme liabilities (the obligations to pay pensions) and investment allocations (how the scheme’s assets are invested). This guide will help you interpret such data without needing to write code, using accessible tools and step-by-step examples. We’ll explore what JSON is, how to view it in tools like Excel Power Query and online converters, how to trace specific values (like participant-level liabilities or scheme-wide asset totals) in a typical JSON structure, and how to cross-check the data for consistency and sense. By the end, you should feel more confident in reading pension JSON data – promoting data literacy and bridging the gap between IT and business, a mission embodied by platforms like WTP Data Lab.

JSON (JavaScript Object Notation) has become a standard format for data exchange in many industries, including pensions. But what exactly is JSON? Simply put, JSON is a text-based data format that uses a structured layout of key–value pairs (like field names and their values) and arrays (ordered lists of values). It is designed to be both human-readable and easy for machines to parse (JSON). In JSON, an “object” is denoted by curly braces { } and contains a set of named fields and values (which can be numbers, text, booleans, or even other nested objects or arrays), while an “array” is denoted by square brackets [ ] and contains a list of values. These structures can be nested to represent complex data relationships. For example, a pension scheme object might contain an array of participant objects with fields like name and liability.
Why are pensions using JSON now? One big driver is the push for standardised, frequent data exchange. For instance, recent regulatory changes such as the Netherlands’ Wet toekomst pensioenen (WTP) – the Future of Pensions Act – mandate more granular and frequent data sharing between pension funds, asset managers, and administrators. The industry responded by adopting common data standards (like the SIVI All Finance Data model) that use JSON to transmit pension information. This means that detailed pension data (covering everything from fund assets and investment returns to participant details and liability values) is now being packaged into JSON files for interoperability (The Future of Pensions Act (WTP) Explained – An Introduction for Pension Professionals – WtpDataLab). JSON is favoured because it’s lightweight, flexible, and widely used in web and data applications – so using it helps different IT systems talk the same language when exchanging pension data.
Similarly, the UK Pensions Dashboards Programme, a landmark initiative aimed at providing individuals with a comprehensive digital overview of their pension savings, mandates the use of JSON schema for data exchange between pension providers and the dashboards. Compliance with these JSON-based standards is compulsory for pension providers in the UK, highlighting the format’s significance in this major program.
For business stakeholders, however, a raw JSON file can look bewildering at first – full of curly braces, quotes, and brackets. The good news is that you don’t need programming skills to make sense of it. With the right approach, JSON can be viewed much like a set of structured tables or an Excel workbook. In the next sections, we’ll introduce tools and techniques to view and interpret JSON easily, focusing on the key information you care about (liabilities and investments) and ensuring the numbers add up correctly.
You might wonder how to open a JSON file if you’re not a developer. Fortunately, there are user-friendly options to convert JSON into a tabular format that’s easy to read and analyse:
An accessible approach is to use a web-based JSON converter, which instantly visualises the JSON structure in your browser. A prime example is the JSON File to Table Converter provided by WTP Data Lab (also available via Foreranger). This tool is designed specifically to help non-technical users make sense of complex JSON data by turning it into clear tables (JSON file to Table Converter – WtpDataLab). To use it:
One of the key benefits of the WTP Data Lab converter is that it’s built with business users in mind. In fact, it explicitly lists “Business Users: Make sense of JSON data without technical knowledge” as one of its purposes. There’s nothing to install or configure – it’s a zero-friction way to decode a JSON file. Whether you’re analyzing an API response or a data export from an admin system, the converter gives an instant visual breakdown of the JSON content. It essentially serves as a bridge between the raw IT format and a human-friendly view, which is ideal for pension professionals who want to quickly get to the numbers.
To cement these concepts, let’s walk through a simplified example of pension scheme data in JSON format and how to interpret it. Below is an anonymised JSON snippet representing a pension scheme. (In a real scenario, the file could be much larger, but this example is kept small and generic for clarity.)
{
“schemeName”: “Sample Pension Plan”,
“totalLiabilities”: 800000,
“totalAssets”: 800000,
“liabilitiesByStatus”: [
{ “status”: “Active”, “value”: 500000 },
{ “status”: “Retired”, “value”: 300000 }
],
“participants”: [
{ “id”: “1001”, “name”: “Alice”, “status”: “Active”, “liability”: 500000 },
{ “id”: “1002”, “name”: “Bob”, “status”: “Retired”, “liability”: 300000 }
],
“assetAllocations”: [
{ “assetClass”: “Bonds”, “value”: 500000 },
{ “assetClass”: “Equities”, “value”: 300000 }
]
}
In this JSON structure:
Reading the above JSON in raw form, we can already pick out important information, but it’s much easier to interpret when converted into tables. Let’s imagine using the JSON to Table Converter on this snippet. We would get a couple of tables: one for participants and one for asset allocations (and possibly a single-row table for the top-level totals, though we can easily see those totals from the snippet).
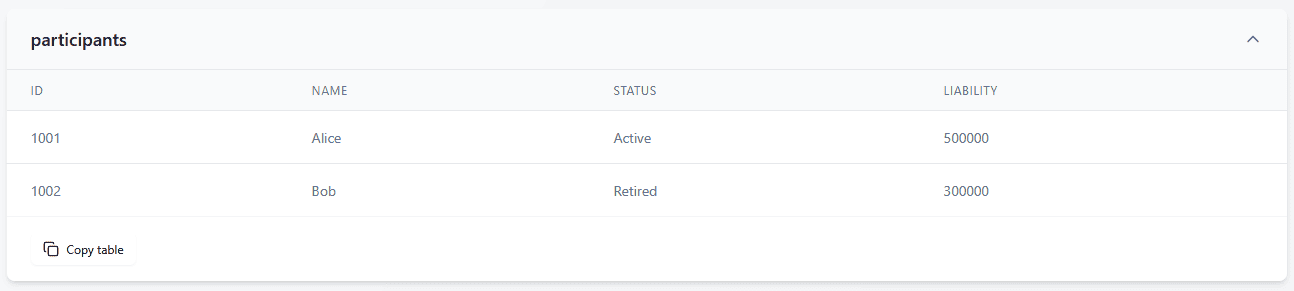
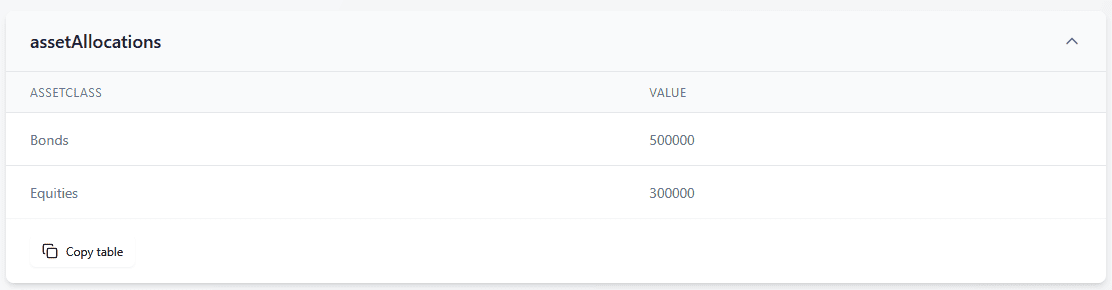
From these tables, an LDI manager might immediately observe the liability split between actives and retirees and consider how the asset mix (e.g., heavy in bonds) aligns with those liabilities. An asset manager or fiduciary manager could quickly note the current allocation and possibly compare it to an investment policy. A pension scheme analyst might use the participant-level table to identify the largest liabilities or to feed into further analysis (like calculating average liability per member, etc.). The key is that the JSON, once in table form, is no longer an IT-centric artefact – it’s a straightforward data table ready for analysis.
When dealing with a large JSON file, you’ll often want to find specific information – for example, “What is the liability value for a particular participant?” or “Where is the total assets figure stored?”. Here are some tips for tracing values in the JSON (assuming you’ve loaded it in a viewer or Excel as described above):
In practice, using the table view from the converter is the easiest way to trace values because you can visually scan and use filters. For instance, suppose you want to check a specific participant’s liability: in the online tool, you could copy the participants’ table into Excel or a Google Sheet and apply a filter on the Name column to find that person. The tables allow you to manipulate the data just like any spreadsheet – sort by liability to see the largest obligations, filter by status, etc. This empowers non-developers to drill into the data with confidence.
Having the data in hand is one thing – interpreting and validating it is the next. Here are some sanity checks and analysis tips to ensure the JSON data “makes sense” in a pensions context:
Performing these checks transforms you from just a data consumer to a critical analyst – you’re ensuring the data is reliable enough to base decisions on. It’s analogous to how you’d review an Excel report or a valuation summary: you’d ensure totals match subtotals, and numbers align with expectations or prior knowledge. JSON is just another format containing that information. With practice, you’ll get a sense of what each field represents and which values should reconcile with each other.
The shift toward JSON for pension data exchange is part of a broader digital transformation in the industry – and it presents an opportunity for business-side professionals to enhance their data literacy. Instead of waiting for IT departments to translate data into reports, tools like the ones we discussed enable you to access the raw data directly and interact with it. This empowers asset managers, LDI managers, and analysts to validate figures, explore details, and gain insights on the fly, making the decision-making process more agile and informed.
WTP Data Lab, in particular, positions itself as a bridge between the technical and business worlds in pensions. By providing user-friendly JSON tools and educational resources, it helps demystify the new data formats introduced by regulations like WTP. For example, a complex SIVI-standard JSON file that might have been only understandable to a programmer can now be visualized by a pension analyst in tables and charts with a few clicks. The heavy lifting (parsing nested structures, handling syntax) is done behind the scenes so you can focus on the substance – the liabilities and investments reflected in those numbers.
Interpreting pension-related JSON files is very achievable for non-developers once you break the task into steps: convert the JSON to a readable format, identify the key figures (liabilities, assets, etc.), and then apply your domain knowledge to analyze and cross-check the data. By leveraging WTP Data Lab JSON Converter (and extending your analysis by moving data into Excel), you turn a once intimidating JSON file into a set of familiar tables. From there, it’s just like working with any financial data – ensuring totals align, spotting trends or outliers, and asking informed questions. As the pension industry increasingly embraces data standards and digital communication, these skills will only grow in importance. Embracing tools that foster transparency and understanding will not only save you time but also enhance trust in the data you’re using for critical decisions.
Armed with this knowledge and toolkit, you – the pension professional – can confidently navigate JSON data and extract the insights you need. In doing so, you’re participating in the broader trend of data-driven pension management, where clarity and accuracy of data lead to better strategies and outcomes. And remember, you’re not alone in this journey: platforms like WTP Data Lab are there to support and continuously bridge that gap between IT and business, so that data format is no barrier to informed action. The era of “JSON for Asset Managers” and “pension analytics for all” is here, and it’s opening up new possibilities for analysis and collaboration in the pensions sector. Happy data exploring!